


Your Company Already Has the Data, but the Answer Still Takes a While
Ask any manager how this week’s sales are going, what the stock level of a specific product is, or how many support tickets are open by region, and it’s common to hear “give me a minute to check and I’ll send it over”. The data exists, it’s in the company’s systems, but pulling the pieces together into a reliable answer still depends on someone opening spreadsheets, exporting reports, or writing a query. While that happens, the decision waits in line, behind whoever has to gather the number.
The most common way to fix this is a business intelligence (BI) dashboard: a panel that’s already connected to the right data sources and returns the number ready-made, without someone having to pull everything together again for every new question that comes up. That’s what AWS Quick Sight does inside AWS, and it’s the subject of this post.
What AWS Quick Sight Is
AWS Quick Sight is AWS’s business intelligence service: it connects data that’s already on AWS, or in other sources, and turns it into interactive dashboards, without the company having to build and maintain a BI team from scratch just for that. Instead of opening a static file, whoever uses the dashboard filters, drills down by period or by region, and sees the updated number without requesting a new report for every question that comes up in a meeting.
How Quick Sight Fits Inside AWS Quick
It’s worth separating the two names, because one is broader than the other. AWS Quick is AWS’s AI and productivity product line: task automation, research, building applications through natural language, and, within it, data analysis. AWS Quick Sight is specifically that part, the visualization and BI one, with the flow of connecting a data source, building a dataset, analyzing it, and publishing a dashboard. Whoever only wants the data dashboard doesn’t need to adopt the rest of the line: Quick Sight works as one piece within the set, not as a closed package that forces you to use everything together.
The Layers, From Raw Data to Whoever Only Opens the Panel
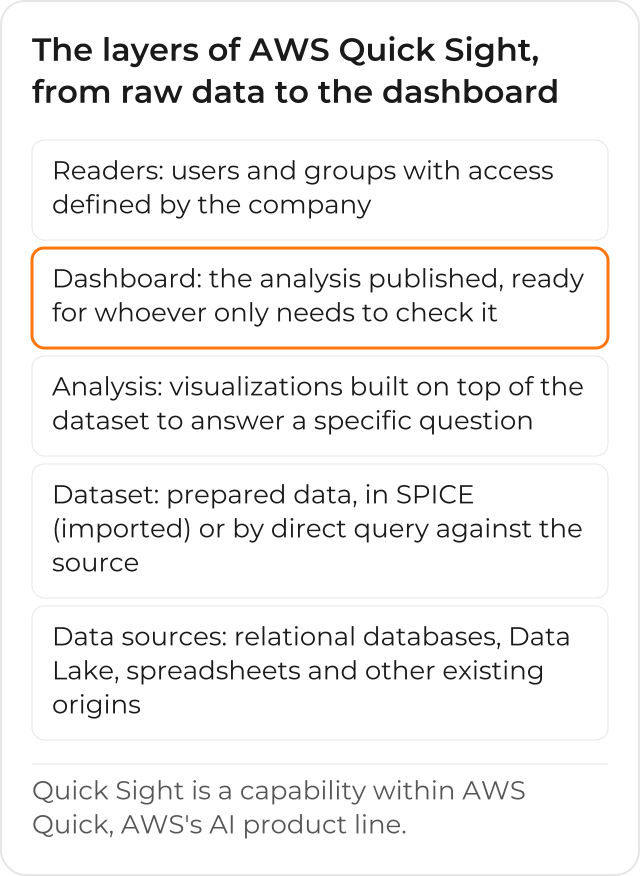
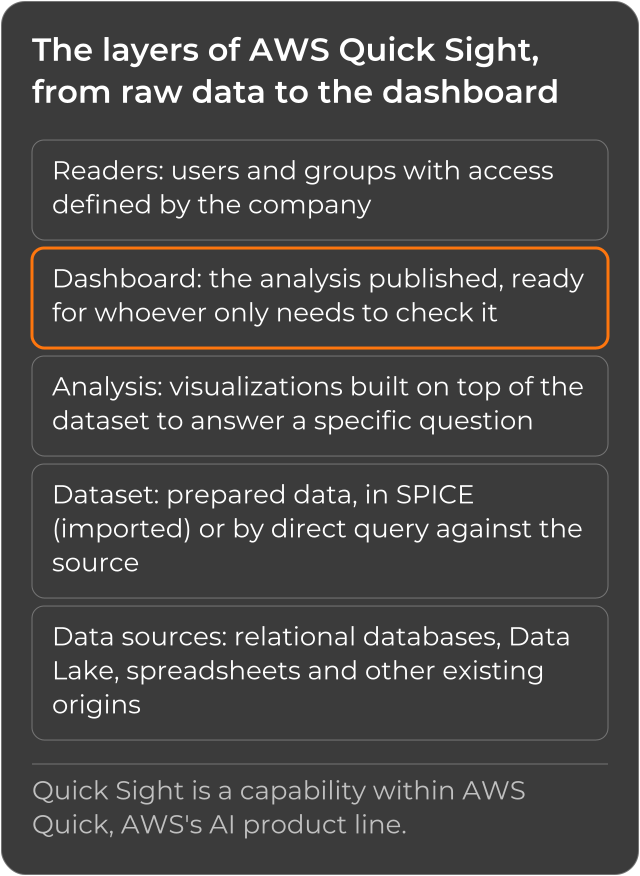
The path a number takes to reach the panel goes through 5 layers, always in the same order. First, the data source: a relational database, a Data Lake, a spreadsheet, or another existing origin. Next, the dataset: the prepared data, already with the fields that matter, imported into Quick Sight or queried straight from the source every time it’s opened (the difference between the two ways is covered in the next section). Then, the analysis: the visualizations that answer specific questions, built on top of that dataset. After that, the dashboard: the analysis published, ready for whoever only needs to check it, without editing anything. And finally, the readers: the users and groups who only open the panel, with the access the company defined for each one.
Where the Data Comes From
Quick Sight connects to data sources the company already has, without requiring everything to be moved or manually duplicated before building the dashboard. Among the supported sources are relational databases such as Amazon RDS, Amazon Redshift, MariaDB, Microsoft SQL Server, MySQL, Oracle, and PostgreSQL, plus files in Amazon S3 (with a manifest that says where the files to import are) and spreadsheets uploaded directly. For whoever already has a Data Lake set up on AWS, Quick Sight connects to it as just another source, without needing to replicate the structure anywhere else.
SPICE or Direct Query: the Difference That Shows Up Day to Day
When creating a dataset, there are two ways for it to fetch the data: import it into SPICE, Quick Sight’s in-memory calculation engine, or query the source directly, every time it’s opened. With a direct query, the data always arrives up to date the moment someone opens the dashboard, but every open generates a query against the original source. With SPICE, the data is imported beforehand, the panel opens faster, and the original source isn’t queried on every click, but you need to schedule the refresh (manual, scheduled, or through an API call) so the data doesn’t stay frozen in time. Neither way is “the right one” for every case: the choice depends on how much simultaneous query load the original source can take and how up to date the number needs to be on the screen of whoever’s looking.
Who’s Responsible for What, Once the Panel Is Live
After the first dashboard is published, it can be shared with specific users or groups on the account, with control over who sees what, instead of everyone getting the same access at once. For sensitive data, you can go beyond simple sharing: row-level security, available in the Enterprise edition, restricts which rows of a dataset each user or group sees, even when everyone accesses the same published dashboard. It’s the difference between giving “all or nothing” access (the common problem of the shared spreadsheet) and giving access only to the slice each person actually needs to see to do their job.
Who Quick Sight Solves For, and Who It’s Not a Priority for Yet
For companies that already have data spread across different systems (an ERP, a CRM, parallel control spreadsheets) and need a central view for decisions, Quick Sight delivers the visualization and analysis part, while the business team focuses on the decision itself, not on building the report. For whoever still has very little data, or still doesn’t know which business question they need to answer, the earlier step usually matters more: organizing the sources before building the first panel avoids building a pretty dashboard on top of data nobody trusts.
How Your Team’s Day to Day Looks After the First Dashboard
After the first dashboard is published, the question that used to take an email and a wait now gets an answer right away: whoever needs the number opens the panel, filters for what matters, and moves straight to the decision. Nobody needs to ask someone to export it again, and the next dashboard, from another area or about another question, reuses the same already-connected dataset, instead of starting over every time someone on the team has a new question.
History of Amazon QuickSight
Amazon QuickSight also went through 2 name changes. On October 9, 2025, it became Amazon Quick Sight, as part of Amazon Quick Suite (source: AWS). On November 9, 2026, when Amazon Quick was renamed to AWS Quick (source: AWS), the product became AWS Quick Sight. This text uses the current name, AWS Quick Sight.
CloudDog, an AWS Advanced Partner, implements AWS Quick Sight for companies that already have data spread across different systems and need a central view for decisions, from the source assessment to the first published dashboard.
