


Before You Start
Before the first dashboard, the routine for whoever needs a number usually means asking someone to pull it from a spreadsheet or look it up straight in the source system, then waiting for the answer to arrive well after the question was asked. Building the first dashboard changes that routine, but the path has an order worth knowing before opening the console.
This is a simplified step-by-step for AWS Quick Sight: for the complete, always-up-to-date reference, the official AWS documentation is the right source. The idea here is to give an overview of the path, for whoever is building their first dashboard and wants to know what to expect before opening the console, without getting lost among screens and options that only make sense after understanding the general order of things.
Whoever already has the data organized in a known source (a production database, a Data Lake, or even a set of files in S3) can skip straight to the practical part of the path below. The bigger chunk of time usually doesn’t go into Quick Sight itself, but into deciding which business question the first dashboard needs to answer, before choosing any visualization.
The Path From the File to the Shared Dashboard
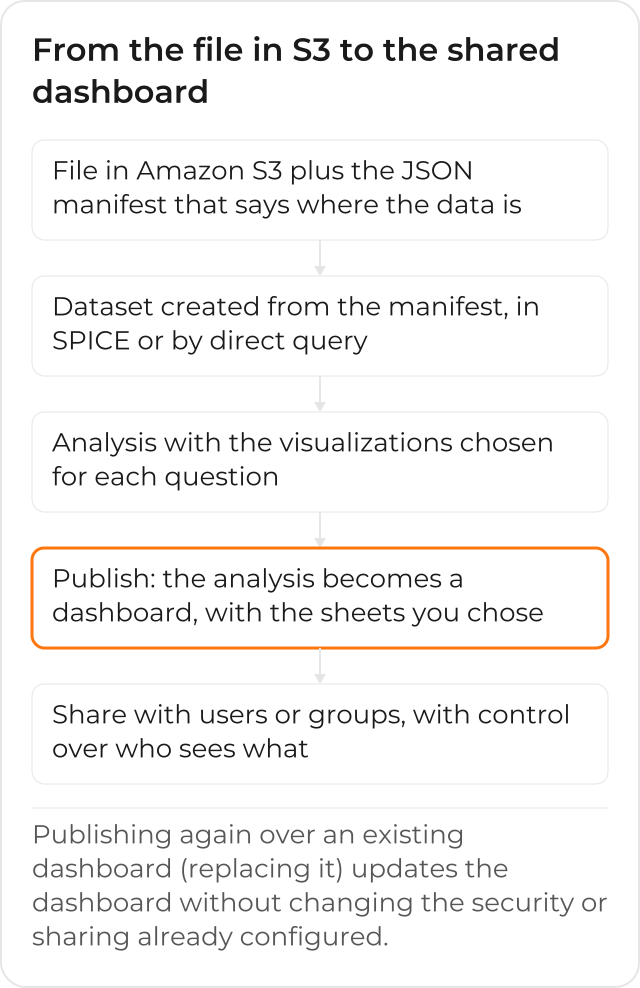
The full path has 5 steps: the data source comes in as a file (with a manifest, if that’s the case) or a connection to a database; the dataset organizes that data; the analysis builds the visualizations; publishing turns the analysis into a dashboard; and sharing gives access to whoever needs to check the result. The sections below go into each one, in the order they usually happen in practice, although it’s common to go back to an earlier step after seeing the result (for example, noticing a dataset is missing a column only after building the first visualization).
Step 1: Connect the Data Source
The first step is connecting Quick Sight to the data source: a database, a Data Lake, or another source already existing at the company. For relational databases like Amazon RDS, Amazon Redshift, or PostgreSQL, the connection asks for the address, port, and access credentials; for Amazon S3, the connection asks for a manifest that says which files to import.
The JSON Manifest, When the Source Is Amazon S3
When the data lives in files in S3, Quick Sight needs a JSON manifest that says where the files to import are and how to read each one. An example, with 2 CSV files from the same bucket:
{
  "fileLocations": [
    {
      "URIs": [
        "s3://minha-empresa-dados/vendas/vendas-2026-10.csv",
        "s3://minha-empresa-dados/vendas/vendas-2026-11.csv"
      ]
    }
  ],
  "globalUploadSettings": {
    "format": "CSV",
    "delimiter": ",",
    "containsHeader": "true"
  }
}
The fileLocations field lists the files (through URIs, one by one, or through
URIPrefixes, an entire bucket or folder) and globalUploadSettings states the file format
(CSV, TSV, JSON, among others) and whether the first row is a header. This example was tested
only with python3 -m json.tool, to confirm the JSON is valid in the format the official
documentation describes; no call was made against a real AWS account.
A common mistake in this manifest is forgetting that every file listed needs to share the same format and the same number of columns: mixing a sales CSV with an inventory one, even if both sit in the same bucket, only works if they go into separate manifests, each one becoming its own dataset. For relational databases, this manifest isn’t needed: the connection already knows how to read the table structure straight from the source.
Step 2: Prepare the Data
With the source connected, you can adjust how the data appears: rename columns, create calculated fields, and combine information from more than one source, if needed. This is also where you decide whether the dataset imports the data into SPICE or queries the source directly every time it’s opened, a decision that affects how fast the dashboard opens later on and how much query load the original source will take.
Combining sources at this stage avoids a common problem: building the visualization first and only afterward discovering that two pieces of data living in different systems need to be joined. Preparing the dataset carefully, before building any chart, usually saves rework down the line.
Step 3: Choose the Visualizations
Every business question has a more suitable visualization: a line chart for change over time, a table for exact numbers, a map for geographic distribution. Quick Sight offers several types to choose from, and each visualization becomes an item within the analysis being built, able to sit on the same screen alongside other visualizations over the same dataset.
Picking the wrong visualization isn’t a technical mistake, it’s a communication problem: a number that needs precision (exactly how much the company billed) calls for a table, while a trend (is revenue going up or down) calls for a chart, even when both come from the same dataset.
Step 4: Publish the Dashboard
Publishing an analysis turns it into a dashboard: you can choose whether all the visualizations go in, or only some of them, and you can publish a new dashboard or replace an existing one. When an existing dashboard is replaced, it’s updated without losing the security settings or the sharing already set up with other people, which matters a lot once the dashboard already has an audience and the source analysis needs a tweak.
Before publishing, you can turn off a few options to simplify what whoever receives the dashboard will see: advanced filters, the menu on each visualization, the option to expand a chart on screen. Not every audience needs all of these options turned on from day one.
Step 5: Share With Access Control
With the dashboard ready, it’s shared with whoever needs to use it, with the same access control the company already applies to other data: specific users or groups, or everyone on the account. Whoever gets access also sees the data feeding the associated analysis, so it’s worth checking beforehand who actually needs to see that slice, instead of opening it up to everyone just because it’s faster in the moment.
Whoever receives the share gets notified by email, with a direct link to the dashboard; entire groups don’t get that individual email, so it’s worth telling the team through another channel the first time a new dashboard goes live.
When It’s Worth Asking for Help
If your company has data spread across different systems and still doesn’t know where to start connecting it all, it’s worth talking to someone who’s already done it: an assessment of the sources avoids the first dashboard being built on a foundation that will need to be redone later, after the team has already gotten used to trusting that number.
How Your Team’s Day to Day Looks After the First Dashboard
After the first dashboard is published and shared, the same question that used to require asking someone to pull a number from a spreadsheet now gets answered right on screen: whoever needs the data opens the panel, filters for the right slice, and moves on to the decision, without waiting for anyone to export anything. The second dashboard, about another question, reuses the same source already connected in Step 1, instead of repeating the whole path from scratch.
History of Amazon QuickSight
Amazon QuickSight also went through 2 name changes. On October 9, 2025, it became Amazon Quick Sight, as part of Amazon Quick Suite (source: AWS). On November 9, 2026, when Amazon Quick was renamed to AWS Quick (source: AWS), the product became AWS Quick Sight. This text uses the current name, AWS Quick Sight.
CloudDog, an AWS Advanced Partner, implements AWS Quick Sight from the source assessment to the first dashboard published and shared with the right team.
